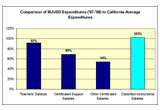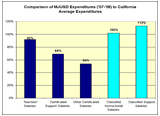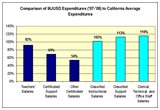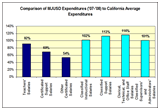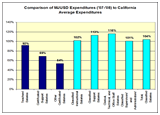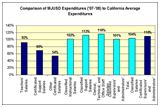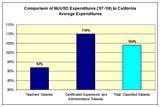
District Expenditures and Salary Comparisons: 2007-2008
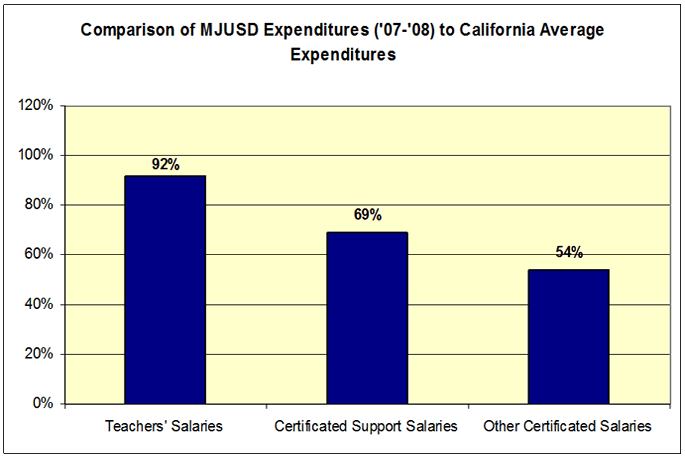
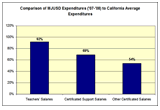
COMMENT: More MUTA Members ("Other Certificated Salaries") – just 54% of statewide average! If you combine these numbers you'll see that MUTA members are actually making less than 90% of the statewide average.
Next slide: People who work with kids who are not MUTA members. ![]()
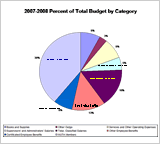
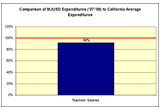
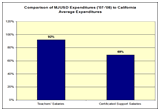
The Data on this page comes from Ed-Data. Their information comes from data that schools provide the California Dept. of Education. The Reports are updated periodically when the CDE certifies and releases new data.
